Part 5: Wear location mapping by industry and equipment
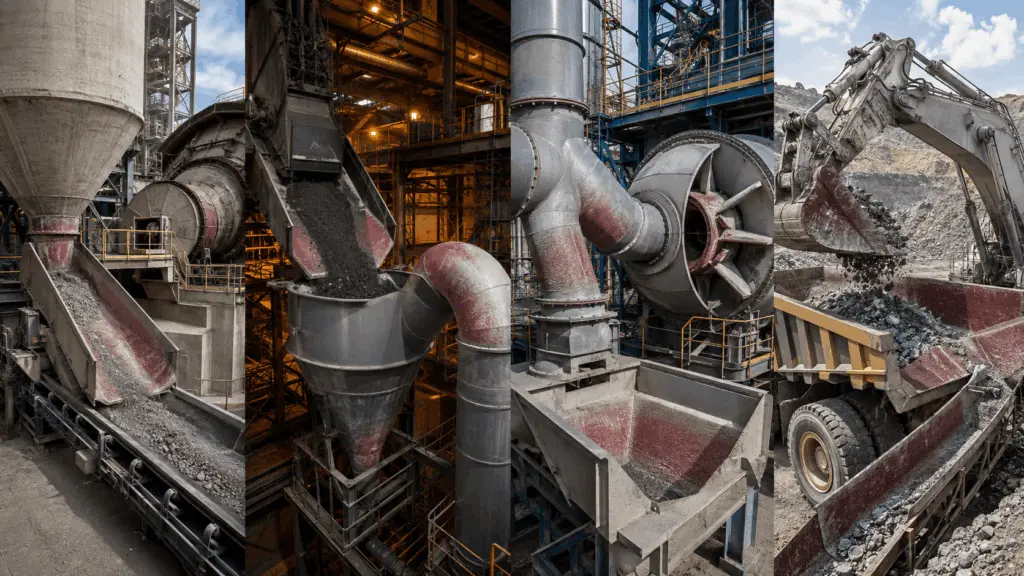
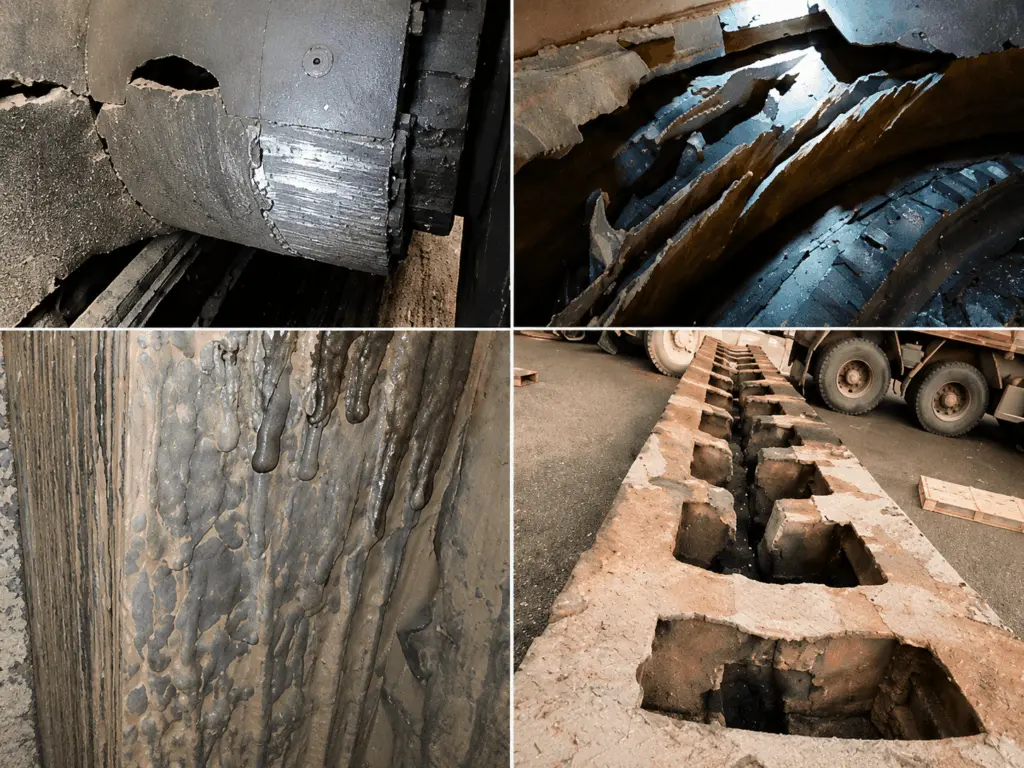
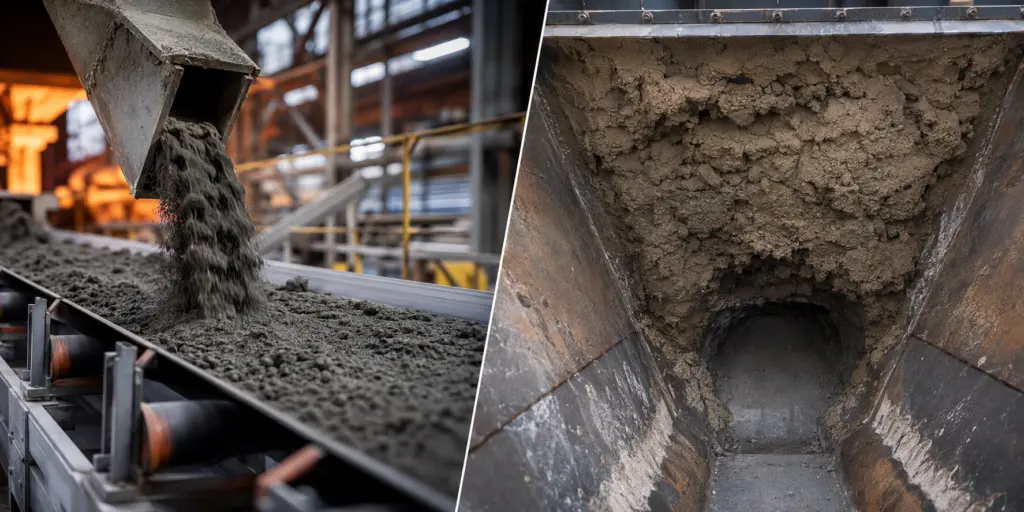
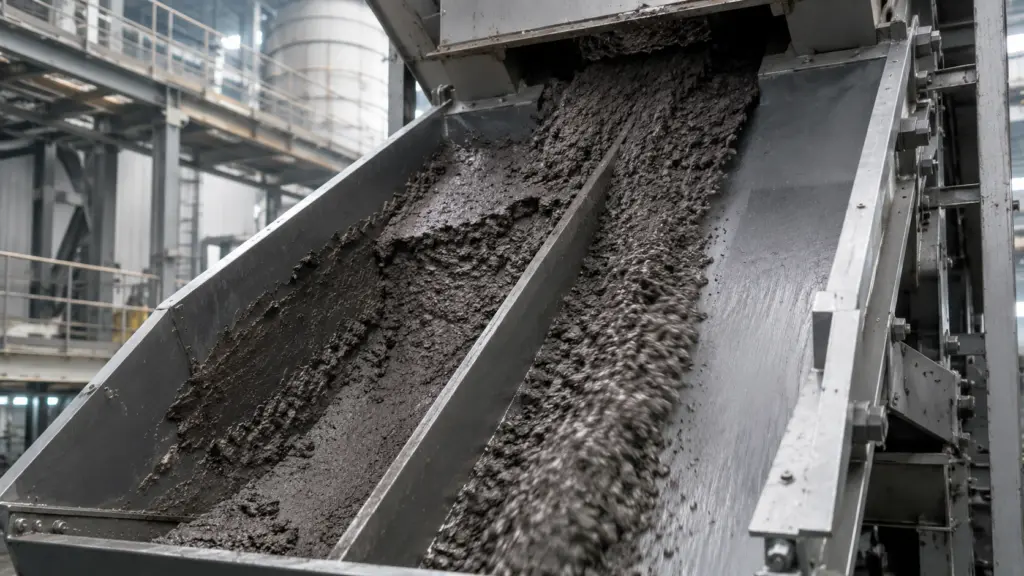
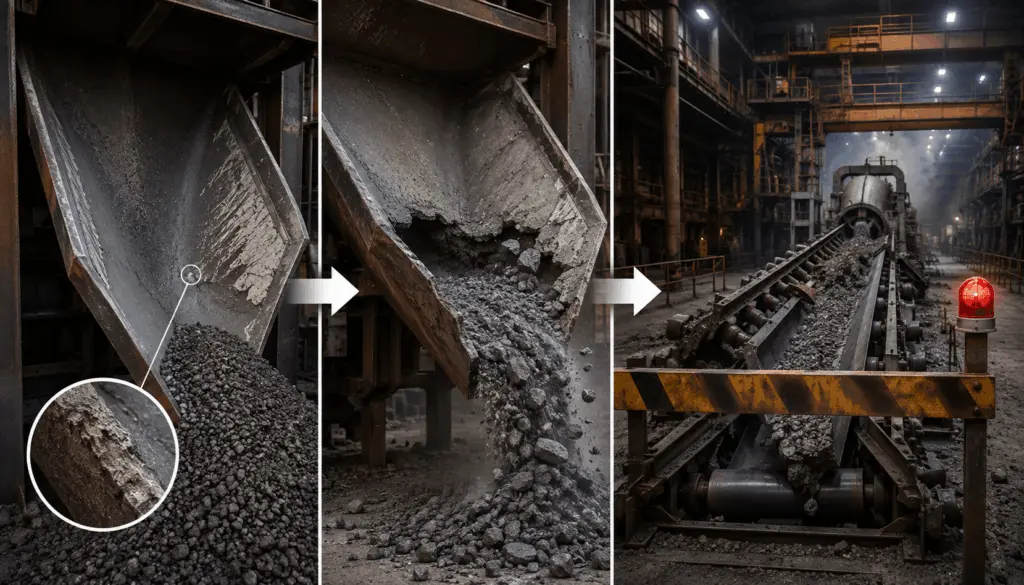
A wear-location map helps identify areas that commonly deteriorate early within a production line. However, the value of the map does not lie in memorizing a list of equipment, but in understanding why one location fails before the adjacent location.
The general principle is to follow the material flow. Locations where the flow changes direction, velocity, or state are often where the conditions acting on the surface change or where multiple mechanisms occur simultaneously. Once this principle is understood, technical personnel can continue narrowing down the locations that need to be inspected even on production lines for which no map is yet available.
1. Early-failure locations are often where the material flow changes
The location that deteriorates first is not necessarily the one subjected to the highest load. In many cases, it is where the material flow changes direction, changes velocity, or transitions to a different state of motion.
In many cases, a change in direction is an indication that should be prioritized for inspection. At bends or elbows, particles have inertia and therefore do not change direction completely with the flow, but continue to impact the wall.
Therefore, bends and elbows may deteriorate faster than straight pipe sections even though they are on the same line and carry the same flow rate. The difference lies in the direction in which particles act on the surface.
1.1. Locations where multiple mechanisms occur simultaneously need to be inspected separately
A location may also deteriorate rapidly when two adverse conditions occur simultaneously, for example:
- the flow changes direction while operating at high temperature
- the location is subjected to both impact and material with high moisture content
When multiple mechanisms reinforce each other, the deterioration rate may differ significantly from that observed when each factor is considered separately.
The method for identifying cases where multiple mechanisms occur simultaneously is presented in Part 1: 4 types of wear and their identifying signs on the surface.
2. Wear-location map in the cement industry
The material flow can be followed from inlet to outlet to identify locations that should be prioritized for inspection.
The outer edge of the separator blade is a typical example of the effect of tangential velocity. On the same blade, velocity increases with radius, so the outer edge may be subjected to more severe conditions than the area closer to the center.
This also shows that it should not be assumed that an entire component requires the same level of protection. The area subjected to greater action needs to be identified before determining the scope of material application.
3. Wear-location map in the iron and steel industry
In an iron and steel production line, operating conditions vary significantly between coke making, sintering, blast-furnace operations, dust collection, and slag handling.
3.1. Cyclone walls wear as a result of the equipment’s operating principle itself
A cyclone operates by generating a swirling flow and directing particles toward the wall. Therefore, the equipment wall is continuously subjected to the action of particle-laden flow.
In this case, the objective cannot be to eliminate the acting mechanism entirely. The problem instead becomes correctly identifying the operating conditions and selecting a material group capable of maintaining a more appropriate service life at that location.
4. Wear-location map in the thermal power industry
The pulverized-coal three-way pipe clearly demonstrates the principle of flow-direction change. A component with three branches can create multiple zones subjected to different forms of action rather than a single common wear point.
4.1. Low particle hardness does not mean that the operating conditions are mild
Limestone has a hardness of approximately 3 on the Mohs scale, significantly lower than quartz. If only scratching potential is considered, this is not a high-hardness particle group.
However, the limestone line may still require wear protection because the governing mechanism is not necessarily scratching.
When limestone passes through the line with large particle size, significant drop height, and high flow rate, impact may become the primary factor.
Therefore, material evaluation at this location needs to consider impact resistance and toughness rather than prioritizing only the highest hardness.
This example shows that one mild factor does not mean that the entire location is under mild operating conditions. Actual conditions need to be evaluated based on the factors acting simultaneously.
5. Wear-location map in the mining industry
5.1. A haul truck body is subjected to two forms of action within the same cycle
The floor and sidewalls of the haul truck body operate under two different conditions.
During loading, the surface is subjected to impact. During unloading, the material continues to slide along the surface.
Therefore, the conditions at this location need to be evaluated under both mechanisms simultaneously, rather than optimizing the material for only one form of action.
5.2. The same principle can occur in different types of equipment
A hydrocyclone discharge spigot and a dust-collection cyclone differ in application but share one principle requiring attention: flow motion causes particles to concentrate in a specific region of the equipment.
Similarly, the outer region of an ore-slurry pump shaft and the outer edge of a separator blade are both associated with changes in velocity with radius.
These examples show that the map is not a list to be memorized. Some material-flow principles can recur across many types of equipment. By understanding the principle, technical personnel can predict locations that should be prioritized for inspection on a production line that has never previously been surveyed.
6. A wear-location map can be developed by following the material flow
For production lines outside the four industries above, the process can begin with a material-flow diagram rather than attempting to find a corresponding equipment list.
The first step is particularly important. If only the equipment is drawn, the diagram primarily shows where the equipment is located. When the material-flow direction is drawn, technical personnel begin to see where the operating conditions change.
Locations where multiple types of change occur simultaneously require particular attention because multiple mechanisms may be acting at the same time.
7. The order of intervention does not depend solely on the severity of wear
The map helps identify which locations are at risk of early deterioration, but it does not directly determine which location should be addressed first.
Four criteria need to be considered together:
Accessibility is a factor that is easily overlooked.
A severely deteriorated location that can only be accessed during a major overhaul may not necessarily be the first task that can be implemented. However, it is a location that needs to be planned early so that the appropriate shutdown window is not missed.
The severity of damage and the implementation sequence are therefore related issues, but they are not entirely the same.
8. Scope of the map
The map in this content was compiled from 39 survey projects within the records used to develop the map, combined with application data from manufacturers’ documentation.
The four industries for which data were compiled are:
- iron and steel
- cement
- thermal power
- mining
The figure of 39 projects represents the sample of project records used to develop this map, not the total number of projects completed by GAC.
For production lines outside these four industry groups, the material-flow method in Section 6 can be used to identify the locations that should be inspected first.
9. Responsibilities of the departments
Developing and using the map requires coordination between survey personnel, operations, and the maintenance planning department.
The order of intervention depends not only on the severity of wear but also on the production plan, accessibility, and the level of impact on operations.
Therefore, the solution provider may support the technical analysis but does not determine the implementation priorities on behalf of the plant.
10. Notes when applying this knowledge
First, the map indicates locations that commonly face a risk of early deterioration, but the actual order may differ between plants. The same process stage may still operate under different material-flow and operating conditions.
Second, the current map focuses on four industries because this is the scope of the data that have been compiled. For production lines outside these four industries, the material-flow principle needs to be used to identify the locations requiring inspection.
Third, the map only indicates where attention is required; it does not indicate the specific severity of wear. The extent of damage still needs to be determined using data from the actual location and monitored over time.
Fourth, the final prioritization decision belongs to the plant. The criteria relating to extent of impact, intervention frequency, shutdown duration, and baseline data only provide a framework to support the decision.
A wear-location map is valuable when it is used to interpret material flow and operating conditions rather than merely to memorize a list of equipment. Locations where the flow changes direction, velocity, or state are points that should be prioritized for inspection; the severity of damage and the order of intervention must then still be determined using actual operating data from each plant.